Structuring and formatting documents
Plan
- Why structure matters
- Tools to structure your text
- Heading levels
- Word styles
- Word templates
- Zotero
- Formatting tables
- Formatting figures
Part 1 - Structuring text
Part 1 - Structuring text
Why structure matters
- Your documents typically have readers; help them read and understand your work!
- A cluttered text without structure can reflect or be interpreted as a lack of understanding.
- Do it for you!
Tools for formatting a document
- Title
- Headings
- Example for research articles: Introduction, Method, Results and Discussion (IMRaD).
- Subheadings are generally recommended!
- APA guidelines for headings and subheadings formatting.
- Paragraphs
- One paragraph per idea
- Topic sentence, supporting sentences, concluding sentence.
- Bullet points and numbered lists
- Table of contents
- Styles and Templates in Microsoft Word (a time saver)
- Zotero (for formatting references)
Demo
Styles and templates in Microsoft Word + Zotero
Part 2 - Formatting tables
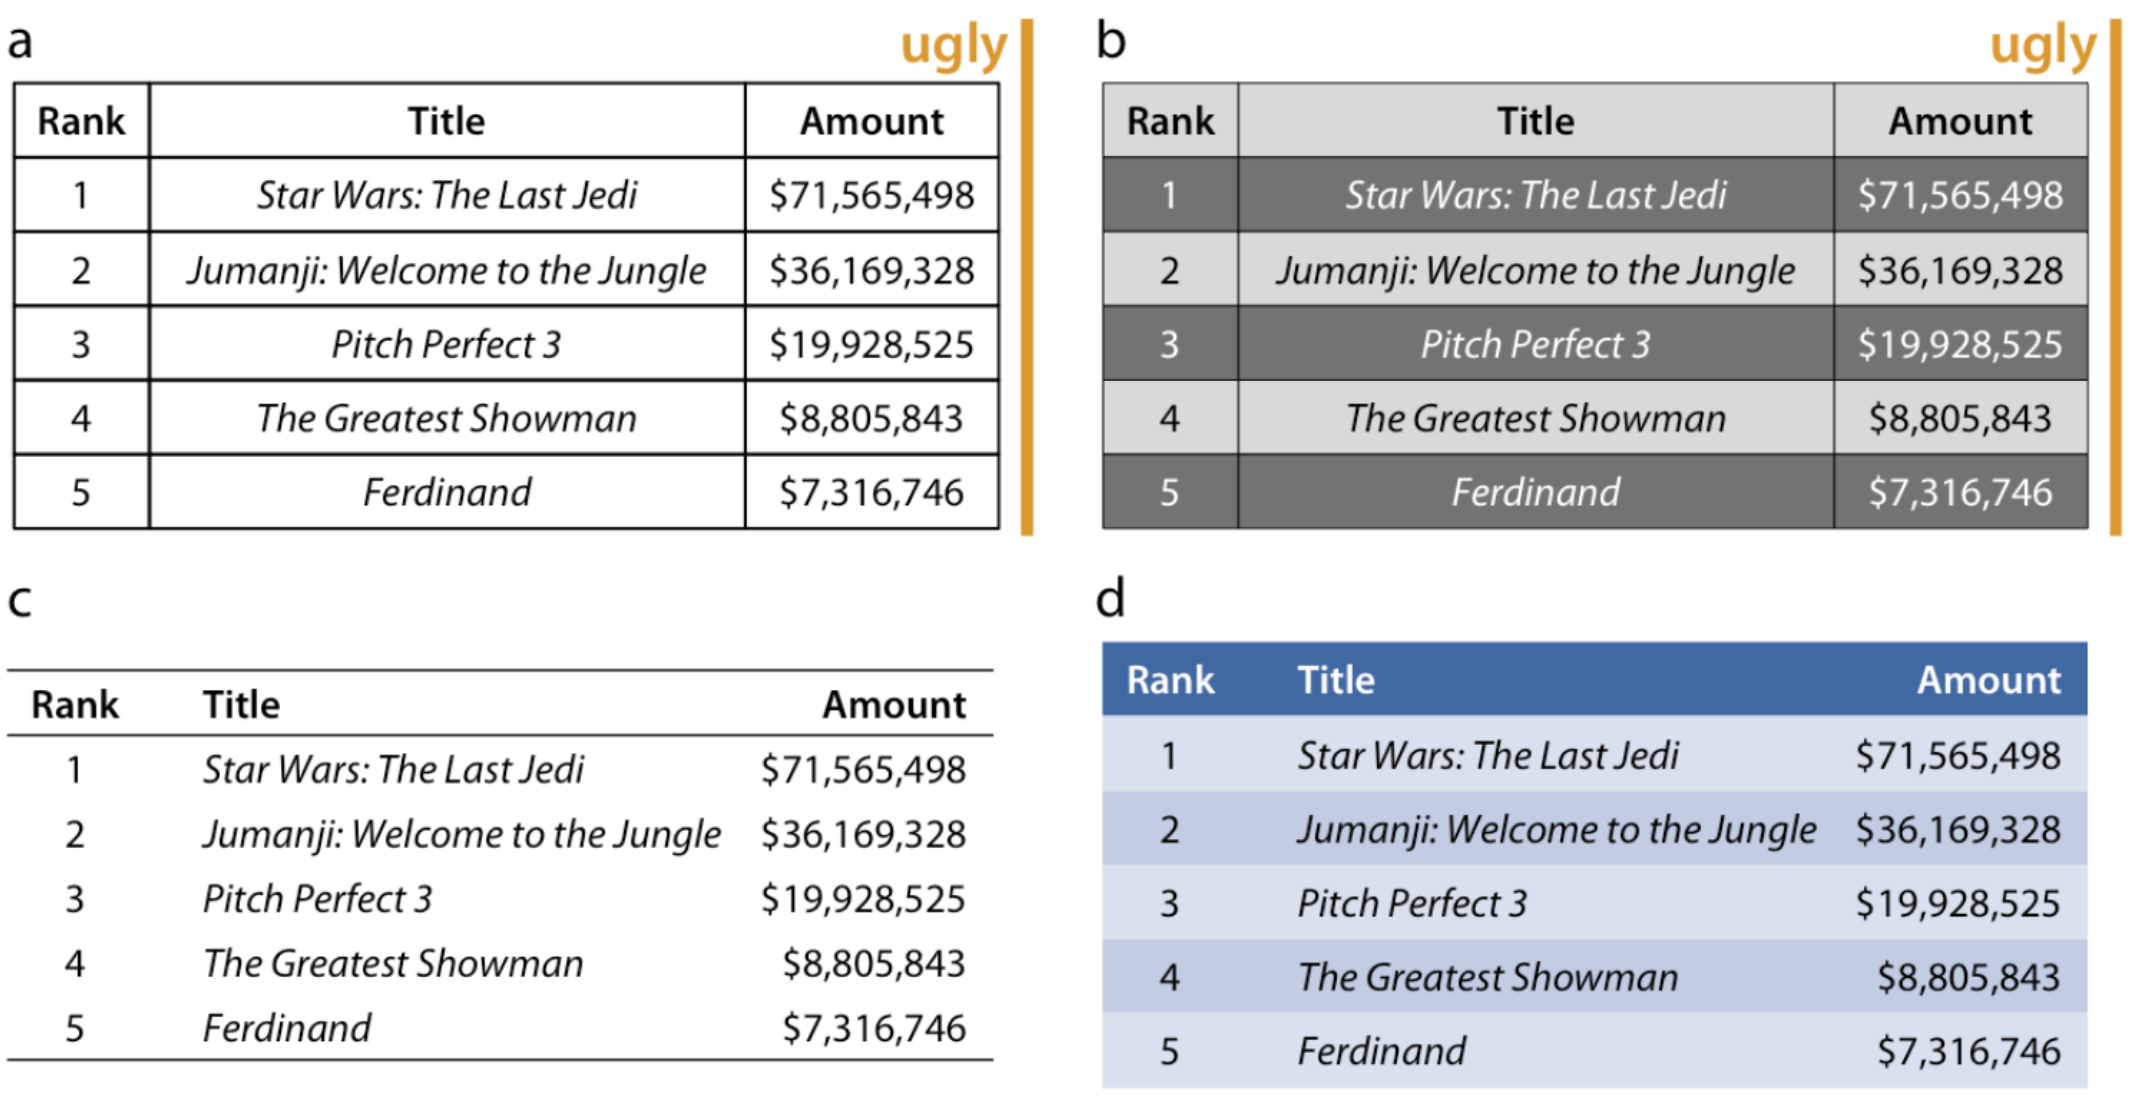
Basic rules of tables formatting
Wilke (2019) recommends to:
- Avoid vertical lines
- Avoid horizontal lines between data rows.
- Use them at the top and bottom of the table and to separate column headers from the content of the table.
- Align text to the left.
- Align numbers to the right and use the same number of decimals (no more than necessary) throughout.
- Align columns containing single characters to the centre.
- Align the column header the same way as the content of the columns.
Example
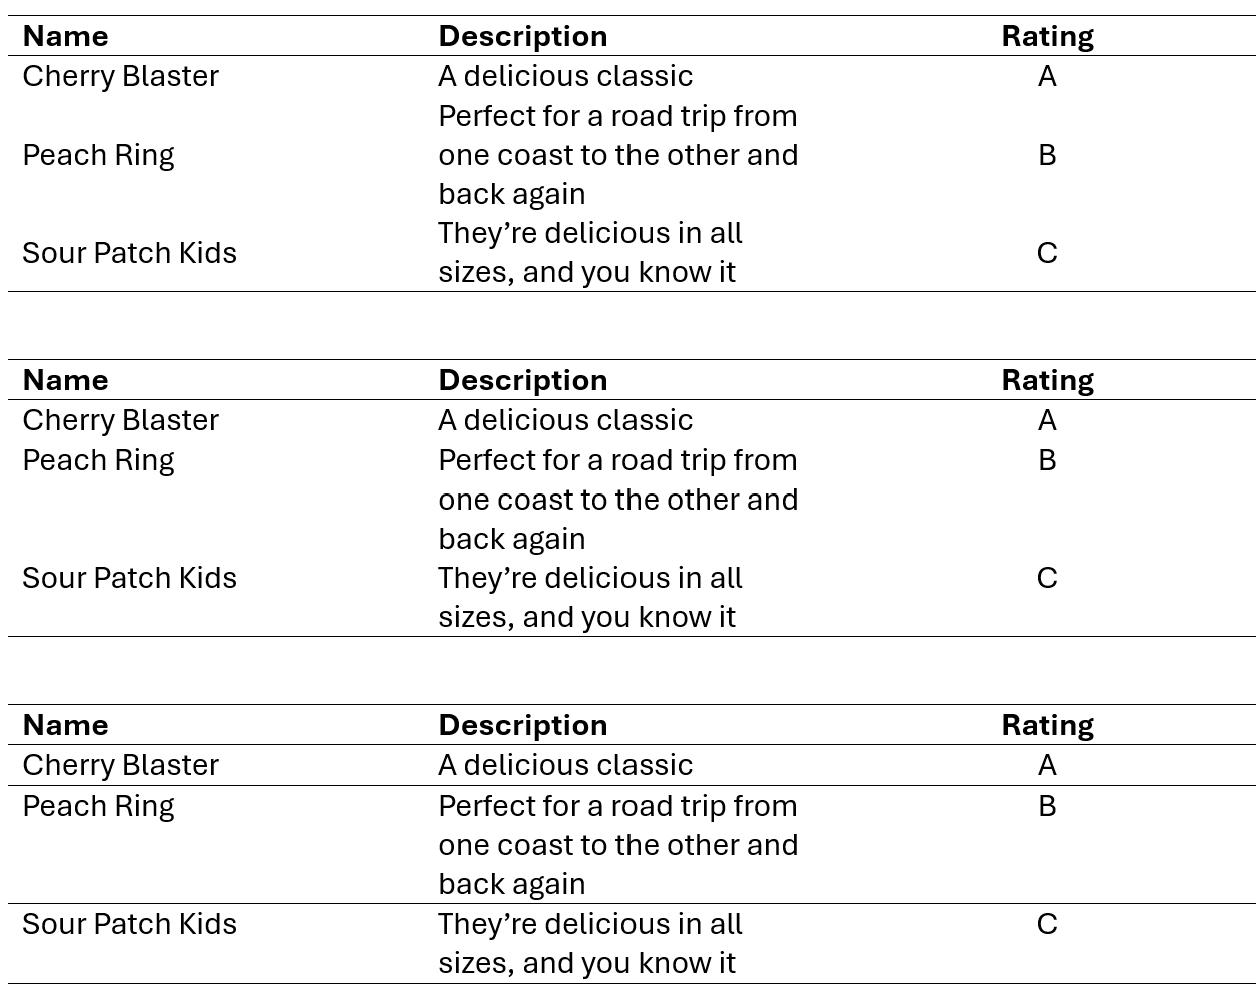
Vertical alignment
Tips
- Keep your tables simple
- In some cases, you may find it easier to
- Create your table in Excel
- Copy it in Word (as a table, not as an image)
- Then use Word to format the table.
Part 3 - Formatting figures
- All axes should be labelled
- Principle of proportional ink (i.e. the y-axis should start at 0).
- Use a colour palette only if it conveys information (not usually relevant unless more than two variables are used for the figure).
- No border
- No shade!
- no 3D!
- For guidance on selecting appropriate graph types, see MGMT2505 - Working with data course (ch. 10 to 12).
References
=======References
>>>>>>> Stashed changes
Wilke, C. 2019. Fundamentals of Data Visualization: A Primer on Making Informative and Compelling Figures. First edition. Sebastopol, CA: O’Reilly Media.